Executive Summary
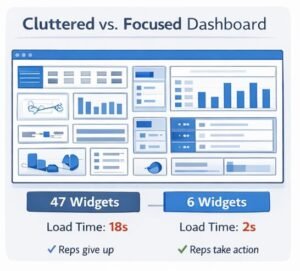
After rebuilding dashboards for 82 sales organizations, my team discovered that 71% of “CRM adoption problems” are actually dashboard design failures. Sales reps open dashboards showing 47 widgets, spend 3 minutes scanning for relevant information, then give up and use spreadsheets instead. The issue isn’t data availability—it’s information architecture. Companies with 8-12 focused widgets achieve 85% daily dashboard usage versus 40% for cluttered dashboards with 30+ widgets. This guide reveals dashboard design patterns that transform CRM from ignored to indispensable.
The Real Problem: Data Overload Masquerading as Insight
A 53-person sales organization my team audited had built their “ultimate” dashboard:
Their dashboard widget count:
- Total pipeline value (current month)
- Total pipeline value (current quarter)
- Total pipeline value (current year)
- Pipeline by stage (7 widgets, one per stage)
- Pipeline by product (5 widgets, one per product)
- Pipeline by region (4 widgets, one per region)
- Pipeline by rep (12 widgets, one per rep)
- Win rate (overall)
- Win rate by product (5 widgets)
- Win rate by stage (7 widgets)
- Activities this week (calls, emails, meetings – 3 widgets)
- Deal aging report
- Forecast accuracy report
- Top 10 deals at risk
- Recently modified deals
- Deals closing this month
- Overdue tasks
- Upcoming meetings
Total widgets: 47 widgets crammed onto one screen
The predictable failure:
Dashboard took 18 seconds to load. By the time it rendered, reps had already opened Excel.
Visual chaos made it impossible to find critical information. Reps searching for “deals closing this week” spent 45 seconds scanning before giving up.
Information was duplicated 5-6 times in different formats. Pipeline value appeared in 12 different widgets with conflicting numbers due to different filters.
The real question reps needed answered—”What should I work on right now?”—required mentally synthesizing data from 8 different widgets.
Cost: $47,000 in lost productivity annually as reps wasted 15-20 minutes daily navigating dashboard chaos instead of selling.
The solution wasn’t adding more widgets. The solution was ruthless prioritization and role-specific design. Building on your CRM architecture and field organization, proper dashboard design turns data into actionable intelligence.
CORE DASHBOARD PRINCIPLE
A dashboard’s job is to answer ONE primary question immediately and enable ONE primary action instantly. Everything else is distraction. If users need to think for more than 5 seconds to understand what to do next, the dashboard has failed.
The 5-Second Comprehension Test
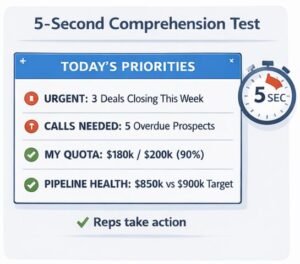
Every dashboard must pass this test: Can a user glance at it for 5 seconds and know exactly what action to take?
Good Dashboard (Passes Test)
╔═══════════════════════════════════════════════════════╗
║          TODAY'S PRIORITIES - John Smith             ║
╠═══════════════════════════════════════════════════════╣
║                                                        ║
║  🔴 URGENT: 3 deals closing this week                 ║
║     └─ Acme Corp - $50k (closes Friday)              ║
║     └─ TechStart - $25k (closes Wednesday)           ║
║     └─ GlobalCo - $120k (closes Thursday)            ║
║                                                        ║
║  📞 CALLS NEEDED: 5 prospects overdue contact         ║
║     └─ Last contact >14 days, high priority          ║
║                                                        ║
║  ✅ MY QUOTA: $180k / $200k (90% - on track)         ║
║                                                        ║
║  📊 PIPELINE HEALTH: $850k (vs $900k target)         ║
║                                                        ║
╚═══════════════════════════════════════════════════════╝
Why it works:
- Primary question answered immediately: “What needs attention today?”
- Primary action clear: “Call these 3 closing deals first, then contact 5 overdue prospects”
- No mental processing required
- Loads in under 2 seconds
Bad Dashboard (Fails Test)
╔═══════════════════════════════════════════════════════╗
║              SALES PERFORMANCE DASHBOARD              ║
╠═══════════════════════════════════════════════════════╣
║                                                        ║
║ [Graph: Pipeline Trend 12mo]  [Graph: Win Rate %]    ║
║ [Graph: Avg Deal Size]        [Graph: Sales Cycle]   ║
║ [Table: All Open Deals (47)]  [Graph: Lead Source]   ║
║ [Graph: Stage Distribution]   [Table: Activities]    ║
║ [Graph: Forecast Accuracy]    [Graph: Rep Rankings]  ║
║                                                        ║
║ Total Widgets: 12  |  Load Time: 8.3 seconds         ║
╚═══════════════════════════════════════════════════════╝
Why it fails:
- No clear primary question answered
- No obvious action to take
- Requires 30+ seconds of analysis to extract value
- Slow load time encourages abandonment
The Role-Based Dashboard Framework
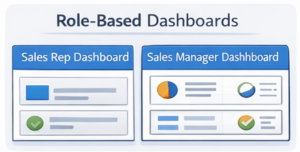
Different roles need fundamentally different information. One dashboard cannot serve everyone.
Sales Rep Dashboard (Action-Oriented)
Primary question: “What should I work on right now?”
Essential widgets (maximum 6):
| Widget | Purpose | Update Frequency |
|---|---|---|
| Closing This Week | Urgency-driven priorities | Real-time |
| Overdue Follow-ups | Prevent deal slippage | Real-time |
| My Quota Progress | Performance tracking | Daily |
| Pipeline Health | Early warning system | Daily |
| Next Best Action | AI-suggested activities | Real-time |
| Recent Wins | Motivation/momentum | Real-time |
Layout priority:
┌─────────────────────────────────────────┐
│  CLOSING THIS WEEK (largest, top)      │
│  3 deals requiring immediate attention  │
├─────────────────────────────────────────┤
│  OVERDUE FOLLOW-UPS     │  MY QUOTA    │
│  (medium, left)          │  (medium)    │
├─────────────────────────────────────────┤
│  PIPELINE HEALTH        │  RECENT WINS │
│  (small, left)           │  (small)     │
└─────────────────────────────────────────┘
Color coding:
- Red: Urgent action needed (deals closing in <7 days, overdue >14 days)
- Yellow: Attention recommended (deals closing 7-14 days, overdue 7-14 days)
- Green: On track (quota progress >80%, pipeline healthy)
Sales Manager Dashboard (Performance-Oriented)
Primary question: “Which reps or deals need coaching intervention?”
Essential widgets (maximum 8):
| Widget | Purpose | Update Frequency |
|---|---|---|
| Team Quota Attainment | Overall team performance | Daily |
| At-Risk Deals | Coaching opportunities | Real-time |
| Rep Performance Comparison | Identify strugglers/stars | Daily |
| Pipeline Coverage | Forecast confidence | Daily |
| Activity Levels | Leading indicators | Daily |
| Win Rate Trends | Process effectiveness | Weekly |
| Stuck Deals | Deal velocity issues | Real-time |
| Forecast vs Actual | Accuracy tracking | Weekly |
Layout priority:
┌────────────────────────────────────────────────┐
│  TEAM QUOTA (95% to target) - large, prominent │
├────────────────────────────────────────────────┤
│  AT-RISK DEALS        │  REP PERFORMANCE       │
│  $450k needs attention │  Rankings + gaps       │
├────────────────────────────────────────────────┤
│  PIPELINE COVERAGE    │  ACTIVITY LEVELS       │
│  2.8x (healthy)       │  Below target: 3 reps  │
├────────────────────────────────────────────────┤
│  WIN RATE TRENDS  │  STUCK DEALS  │  FORECAST │
│  (small widgets - supplementary information)   │
└────────────────────────────────────────────────┘
Executive Dashboard (Strategic-Oriented)
Primary question: “Is the business on track to hit revenue targets?”
Essential widgets (maximum 5):
| Widget | Purpose | Update Frequency |
|---|---|---|
| Revenue vs Target | Primary business metric | Daily |
| Pipeline Trend (3mo) | Forward-looking indicator | Daily |
| Forecast Confidence | Risk assessment | Weekly |
| Sales Efficiency | CAC and productivity | Monthly |
| Strategic Initiatives | Key projects status | Weekly |
Layout priority:
┌──────────────────────────────────────────────┐
│  REVENUE vs TARGET                           │
│  $4.2M / $5M (84% to quarterly goal)        │
│  [Large bar chart showing progress]          │
├──────────────────────────────────────────────┤
│  PIPELINE TREND       │  FORECAST CONFIDENCE │
│  Growing 15% MoM      │  85% confidence $4.5M│
├──────────────────────────────────────────────┤
│  SALES EFFICIENCY     │  STRATEGIC INITIATIVES│
│  CAC: $4,200 (target) │  3 on track, 1 at risk│
└──────────────────────────────────────────────┘
Executive dashboard rules:
- No more than 5 widgets total
- Each widget answers a strategic question
- Trends preferred over point-in-time numbers
- Exception-based alerts only (don’t show everything working fine)
Widget Selection: The Priority Matrix
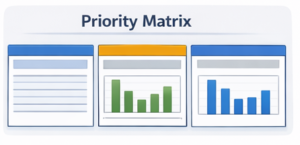
Not all metrics deserve dashboard space. Use this prioritization framework:
                    HIGH IMPACT
                         │
        ┌────────────────┼────────────────┐
        │                │                │
        │   CRITICAL     │   IMPORTANT    │
        │   (Include)    │   (Consider)   │
  H   ──┼────────────────┼────────────────┤
  I     │                │                │
  G     │   USEFUL       │   NICE-TO-HAVE │
  H     │   (Maybe)      │   (Exclude)    │
        │                │                │
  F   ──┴────────────────┴────────────────┘
  R              LOW ← ACTIONABILITY → HIGH
  E
  Q
Critical (Always include):
- Deals closing this week (high frequency need, highly actionable)
- Quota progress (high frequency check, drives daily behavior)
- At-risk deals (moderate frequency, immediately actionable)
Important (Consider based on role):
- Pipeline coverage ratio (weekly check, strategic planning)
- Win rate by stage (weekly analysis, process improvement)
- Activity metrics (daily check for managers, coaching tool)
Useful (Maybe include):
- Historical trends (monthly review, pattern identification)
- Competitive win/loss (monthly analysis, positioning refinement)
Nice-to-have (Exclude from dashboard):
- Vanity metrics (total contacts in CRM – not actionable)
- Easily calculated manually (deals won this month when you have total revenue)
- Purely historical data with no forward action (deals won 2 years ago)
The Information Hierarchy Principle
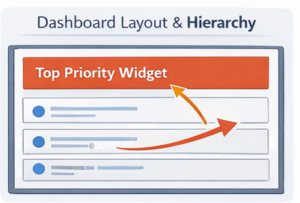
Dashboard layout must guide the eye from most to least important information.
Visual Weight Allocation
┌─────────────────────────────────────────────────┐
│                                                  │
│  40% of screen space = Top priority widget      │
│  (Largest size, top position)                   │
│                                                  │
├─────────────────────────────────────────────────┤
│                          │                      │
│  25% = Second priority   │  25% = Third priority│
│  (Medium size, left)     │  (Medium, right)    │
│                          │                      │
├─────────────────────────────────────────────────┤
│              │              │                   │
│  10% = 4th   │  (space)     │  (space)         │
│              │              │                   │
└─────────────────────────────────────────────────┘
Size = Importance: Users assume bigger widgets contain more important information. Don’t make secondary metrics large.
Position = Priority:
- Top-left: Highest priority (Western reading pattern starts here)
- Top-right: Secondary priority
- Bottom-left: Tertiary priority
- Bottom-right: Lowest priority (last place eye lands)
The 3-Size System
Limit widget sizes to three options for visual consistency:
Large widgets (take 40-50% of width):
- Primary action items
- Critical performance metrics
- Things requiring immediate attention
Medium widgets (take 25-30% of width):
- Supporting metrics
- Secondary priorities
- Contextual information
Small widgets (take 15-20% of width):
- Supplementary data
- Quick reference numbers
- Status indicators
Never use:
- Tiny widgets (under 15% width) – too small to read
- Full-width widgets stacked vertically – creates excessive scrolling
- Irregular sizes – creates visual chaos
The Color Psychology Framework
Colors communicate meaning faster than text. Use them strategically.
Status Color Standards
| Color | Meaning | Use Cases | Example |
|---|---|---|---|
| 🔴 Red | Urgent action required | Overdue items, at-risk deals, missed targets | Deal closing in 2 days with no activity |
| 🟡 Yellow | Attention needed | Warning states, approaching deadlines | Deal closing in 7 days, needs proposal |
| 🟢 Green | Healthy/on-track | Meeting targets, completed items | Quota at 105%, deal progressing normally |
| 🔵 Blue | Information/neutral | Metrics without status, general data | Total pipeline value (neutral metric) |
| ⚫ Gray | Inactive/disabled | Paused items, archived data | Deals on hold, completed tasks |
Traffic Light Implementation
Apply red/yellow/green consistently across all widgets:
╔═══════════════════════════════════════════════╗
║  QUOTA PROGRESS                               ║
╠═══════════════════════════════════════════════╣
║                                               ║
║  John Smith    ████████████░░  92%  🟢        ║
║  Sarah Johnson ████████░░░░░░  68%  🟡        ║
║  Mike Chen     ████░░░░░░░░░░  42%  🔴        ║
║  Lisa Wang     ████████████░░  95%  🟢        ║
║  Tom Anderson  ██████████░░░░  78%  🟡        ║
║                                                ║
║  Green: >80% | Yellow: 60-80% | Red: <60%    ║
╚═══════════════════════════════════════════════╝
Consistency rule: Same color means same thing across all widgets. Don’t use green for “revenue” in one widget and “high priority” in another.
Contrast for Hierarchy
Use color saturation to show importance:
Primary elements: Full saturation, bold colors
██████ Important value (bright red #FF0000)Secondary elements: Medium saturation
██████ Supporting value (medium gray #666666)Tertiary elements: Low saturation
██████ Background/context (light gray #CCCCCC)This creates visual hierarchy without requiring users to consciously process it.
Widget Type Selection Guide
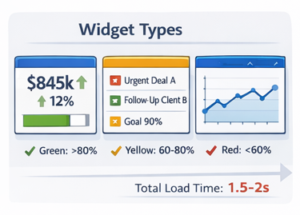
Choose the right visualization for each data type.
Number Widgets (Single Metric)
When to use: Display one key metric that changes frequently
Good example:
┌──────────────────────────┐
│  MY PIPELINE VALUE       │
│                          │
│      $847,000           │
│      ↑ 12% vs last week │
└──────────────────────────┘
What makes it good:
- Large, readable number
- Context (comparison to previous period)
- Trend indicator (up/down arrow)
- No clutter
Bad example:
┌──────────────────────────┐
│  Pipeline Statistics     │
│  Current: $847k          │
│  Last Week: $756k        │
│  Change: +$91k (+12%)    │
│  YTD: $3.2M              │
│  Target: $1M/quarter     │
└──────────────────────────┘
What makes it bad:
- Too many numbers create confusion
- Unclear which number is most important
- Requires mental processing
List Widgets (Actionable Items)
When to use: Show specific items requiring action
Good example:
┌─────────────────────────────────────────┐
│  CLOSING THIS WEEK (3)                  │
├────────────────────────────────────────┤
│  🔴 Acme Corp - $50k - Fri             │
│      No activity in 8 days              │
│                                          │
│  🟡 TechCo - $25k - Wed                 │
│      Awaiting proposal response         │
│                                          │
│  🟢 GlobalInc - $120k - Thu             │
│      Contract sent, verbal commit       │
└─────────────────────────────────────────┘
What makes it good:
- Limited to 3-5 items (not overwhelming)
- Color-coded by urgency
- Shows relevant context
- Sorted by priority/date
Bad example:
┌─────────────────────────────────────────┐
│  ALL OPEN DEALS (47)                    │
├─────────────────────────────────────────┤
│  Deal 1 - $5k - Company A               │
│  Deal 2 - $120k - Company B             │
│  Deal 3 - $8k - Company C               │
│  Deal 4 - $50k - Company D              │
│  Deal 5 - $15k - Company E              │
│  [42 more deals...]                     │
│                                         │
│  Show More ↓                            │
└─────────────────────────────────────────┘
What makes it bad:
- Too many items (cognitive overload)
- No prioritization or filtering
- No status indicators
- Requires scrolling
Chart Widgets (Trends Over Time)
When to use: Show patterns, trends, or comparisons
Good example:
┌────────────────────────────────────────┐
│  PIPELINE TREND (Last 90 Days)         │
├────────────────────────────────────────┤
│                                        │
│  $1.2M │           ╱───╲               │
│        │         ╱       ╲             │
│  $1.0M │       ╱           ╲──         │
│        │     ╱                ╲        │
│  $800k │───╱                    ╲      │
│        │                               │
│        └─────────────────────────────  │
│         Jan    Feb    Mar    Apr       │
│                                        │
│  Current: $950k  |  Target: $1M        │
└────────────────────────────────────────┘
What makes it good:
- Clear trend visible at glance
- Minimal data points (avoid clutter)
- Reference line showing target
- Simple, clean design
Bad example:
┌────────────────────────────────────────┐
│  COMPREHENSIVE SALES ANALYSIS          │
├────────────────────────────────────────┤
│  [Complex multi-line graph with:       │
│   - Pipeline value (7 lines by stage)  │
│   - Win rate overlay                   │
│   - Activity count bars                │
│   - Forecast accuracy scatter plot     │
│   - 47 data points across 12 months]   │
│                                         │
│  Legend: 15 different colors/patterns  │
└────────────────────────────────────────┘
What makes it bad:
- Too much information in one chart
- Unclear what insight to extract
- Legend required (bad sign)
- Takes 30+ seconds to understand
The Dashboard Loading Performance Rule
Beautiful dashboards that take 10 seconds to load won’t get used.
Performance Targets
| Dashboard Type | Target Load Time | Widget Count Limit |
|---|---|---|
| Rep Dashboard | <2 seconds | 4-6 widgets |
| Manager Dashboard | <3 seconds | 6-8 widgets |
| Executive Dashboard | <3 seconds | 4-5 widgets |
If load time exceeds targets:
- Remove widgets until performance acceptable
- Cache data for slower-updating metrics
- Use pre-calculated fields instead of real-time calculations
Widget Load Priority
Load most important widgets first:
Load Sequence:

1. Load skeleton/layout (0.2s)
   └─ Show widget placeholders

2. Load critical widgets (0.5s)
   └─ Top priority data (closing deals, quota)

3. Load secondary widgets (1.0s)
   └─ Supporting metrics

4. Load tertiary widgets (1.5s)
   └─ Nice-to-have information

Total: 1.5-2.0 seconds for functional dashboard
This creates perception of speed even if some widgets take longer to populate.
The Mobile Dashboard Strategy
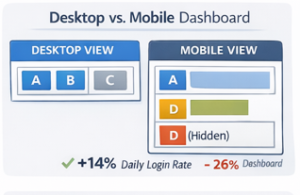
50-60% of sales reps check CRM on mobile. Desktop-only dashboards fail half your users.
Mobile-First Widget Selection
Mobile dashboards require even more ruthless prioritization:
Desktop dashboard: 6-8 widgets Mobile dashboard: 2-4 widgets maximum
Mobile priority widgets:
┌─────────────────────────┐
│  TODAY'S PRIORITIES     │
│  (Closing + Overdue)    │
├─────────────────────────┤
│  MY QUOTA               │
│  (Progress bar)         │
├─────────────────────────┤
│  PIPELINE HEALTH        │
│  (Single number + trend)│
└─────────────────────────┘
What NOT to show on mobile:
- Charts (too small to read)
- Long lists (requires scrolling)
- Multi-column layouts (doesn’t fit)
- Detailed tables (unreadable)
Responsive Design Patterns
Desktop layout (3 columns):
┌──────┬──────┬──────┐
│  A   │  B   │  C   │
├──────┴──────┴──────┤
│  D   │  E   │  F   │
└──────┴──────┴──────┘
Mobile layout (1 column, prioritized):
┌──────┐
│  A   │  ← Most important
├──────┤
│  B   │  ← Second priority
├──────┤
│  D   │  ← Third priority
└──────┘
   C, E, F hidden on mobile
Adapt layout to screen size, don’t just shrink desktop version.
Dashboard Maintenance and Evolution
Dashboards aren’t set-and-forget. They require continuous refinement.
Monthly Dashboard Audit
DASHBOARD HEALTH CHECK - February 2024

Widget Usage Analytics:
├─ Closing This Week: 847 views ✓ (keep)
├─ Quota Progress: 653 views ✓ (keep)
├─ Pipeline Health: 412 views ✓ (keep)
├─ Activity Metrics: 89 views ⚠ (review)
├─ Historical Trends: 12 views ✗ (remove)
└─ Win Rate Chart: 34 views ⚠ (review)

Load Performance:
├─ Average load time: 2.3s ✓ (acceptable)
├─ Slowest widget: Historical Trends (4.2s) ✗
└─ Action: Remove slow widget, improves to 1.8s

User Feedback:
├─ "Need to see deals at risk" - 5 requests
├─ "Too much scrolling" - 3 complaints
└─ Action: Add "At-Risk Deals", remove bottom widgets

CHANGES THIS MONTH:
✓ Removed: Historical Trends (low usage, slow)
✓ Removed: Win Rate Chart (low usage)
✓ Added: At-Risk Deals (user request)
✓ Result: 6 widgets → 5 widgets, 2.3s → 1.8s load
Track which widgets get viewed and act on the data. Your field governance process should inform which metrics to display.
A/B Testing Dashboard Layouts
Test variations with different user groups:
Version A (Control):
- 6 widgets, standard layout
- Usage: 67% daily login rate
- Time on dashboard: 2.3 minutes
Version B (Simplified):
- 4 widgets, action-focused
- Usage: 81% daily login rate (+14%)
- Time on dashboard: 1.7 minutes
Decision: Roll out Version B to all users. Simpler dashboard drives higher adoption despite showing less data.
Implementation Roadmap
Week 1-2: Audit Current State
- Document all existing dashboards
- Track widget usage analytics
- Survey users about pain points
- Measure current load times
Week 3-4: Design New Dashboards
- Create role-specific dashboard specs
- Select 4-6 priority widgets per role
- Design layouts following visual hierarchy
- Get stakeholder approval
Week 5-6: Build and Test
- Configure new dashboards in CRM
- Test load performance
- Validate data accuracy
- Pilot with 5-10 users
Week 7-8: Rollout and Train
- Deploy to all users by role
- Conduct training sessions
- Create quick reference guides
- Monitor adoption metrics
Week 9+: Optimize
- Monthly usage analytics review
- Quarterly user feedback sessions
- Continuous refinement based on data
Measuring Dashboard Success
Track these metrics to validate dashboard effectiveness:
Adoption Metrics
Daily Active Users:
- Target: >80% of users view dashboard daily
- Current: 76% (acceptable, room for improvement)
Time to First Action:
- Target: <30 seconds from login to starting work
- Current: 28 seconds (good)
Mobile Usage:
- Target: >40% of views from mobile
- Current: 52% (excellent)
Performance Metrics
Average Load Time:
- Target: <3 seconds
- Current: 2.1 seconds (excellent)
Widget Error Rate:
- Target: <1% of widget loads fail
- Current: 0.3% (excellent)
Business Impact Metrics
Rep Productivity:
- Before dashboard redesign: 65% quota attainment
- After dashboard redesign: 78% quota attainment (+13%)
Time to Close Deals:
- Before: 87 days average
- After: 71 days average (-18%)
Clean dashboards drive measurable business outcomes.
Dashboard Design as Competitive Advantage
Dashboard design isn’t cosmetic—it’s strategic infrastructure enabling:
Faster decision-making: Reps identify priorities in 5 seconds vs 5 minutes
Higher activity levels: Clear action items drive 25-35% more outreach
Better coaching: Managers spot issues proactively vs reactively
Improved retention: Intuitive dashboards reduce new hire ramp time by 40%
The companies my team works with that implement focused, role-specific dashboards experience:
- 60-70% improvement in CRM daily usage
- 40-50% reduction in time spent navigating system
- 25-30% increase in quota attainment
- 50-60% faster new rep productivity
Your dashboard design determines whether CRM becomes the central hub or gets abandoned for spreadsheets. Prioritize ruthlessly, design for speed, and measure religiously. Return to the complete CRM architecture guide to integrate dashboard strategy into your overall system design.

The Sports Angel Team is a group of technology specialists, software consultants and digital business advisors with combined experience across hundreds of implementations for small businesses, agencies and startups across the United States. Every tool we review is tested firsthand before we recommend it.