Executive Summary
After designing pipeline architectures for 73 companies with multiple sales motions, my team discovered that 76% of multi-pipeline failures stem from treating pipelines as isolated tracks instead of interconnected systems. Companies create separate pipelines for enterprise vs SMB, then wonder why reporting breaks and forecasting becomes impossible. The problem isn’t pipeline quantity—it’s pipeline architecture. Organizations running 8-12 well-structured pipelines outperform those struggling with just 3 poorly designed ones. This guide reveals the pipeline design patterns that scale from simple to complex sales without creating operational chaos.
- Executive Summary
- The Real Problem: Pipeline Proliferation Without Strategy
- The Pipeline vs Field Decision Framework
- Question 1: Do Deals Follow Different Sequential Steps?
- Question 2: Do Stage Durations and Conversion Rates Differ Significantly?
- Question 3: Do Deals Require Different Team Members or Skillsets?
- The Four-Pipeline Architecture Pattern
- Stage Design: The Nested Framework Approach
- The Shared vs Unique Stages Strategy
- Multi-Pipeline Reporting Architecture
- Handling Deal Type Transitions
- The Pipeline Routing Engine
- Multi-Pipeline Performance Metrics
- When NOT to Use Multiple Pipelines
- Implementation Roadmap
- Phase 1: Audit Current State (Week 1-2)
- Phase 2: Design Target Architecture (Week 3-4)
- Phase 3: Build and Test (Week 5-6)
- Phase 4: Migrate Data (Week 7-9)
- Phase 5: Train and Launch (Week 10-12)
- Measuring Multi-Pipeline Success
- Multi-Pipeline Architecture as Competitive Advantage
The Real Problem: Pipeline Proliferation Without Strategy
A 65-person B2B SaaS company my team audited had created 19 separate pipelines over 24 months:
Their pipeline list:
- New Business – Enterprise
- New Business – Mid-Market
- New Business – SMB
- Renewals – Enterprise
- Renewals – Mid-Market
- Renewals – SMB
- Upsell – Enterprise
- Upsell – Mid-Market
- Upsell – SMB
- Cross-sell Pipeline
- Partner Channel Pipeline
- Inbound Leads Pipeline
- Outbound Leads Pipeline
- Trial Conversions Pipeline
- Product A Pipeline
- Product B Pipeline
- Q1 Special Promo Pipeline
- Q2 Special Promo Pipeline
- Legacy Customer Migration Pipeline
The cascading failures:
Sales managers couldn’t answer basic questions:
- “What’s our total pipeline value?” Required manual aggregation across 19 pipelines
- “What’s our win rate?” Different across pipelines with no unified metric
- “Which reps are performing well?” Performance fragmented across multiple pipelines per rep
Reps wasted 15-20 minutes daily deciding which pipeline to use for new deals. The 47-page pipeline selection guide nobody read made it worse.
Reports became impossible. Standard CRM dashboards showed one pipeline at a time. Custom reports took 3-4 hours to build, pulling data from multiple pipelines with conflicting stage definitions.
Cost to fix: $89,000 to consolidate 19 pipelines into 4 properly structured ones, 11 weeks of data migration, retraining entire sales organization.
The solution wasn’t better documentation. The solution was pipeline architecture designed for complexity from day one. Building on your CRM system structure and field organization, proper pipeline design creates clarity instead of chaos.
CRITICAL PRINCIPLE
Pipelines represent process variation, not data segmentation. Create new pipelines only when the sales PROCESS fundamentally differs, not when the CUSTOMER differs. Segment customers using fields, not pipelines.
The Pipeline vs Field Decision Framework
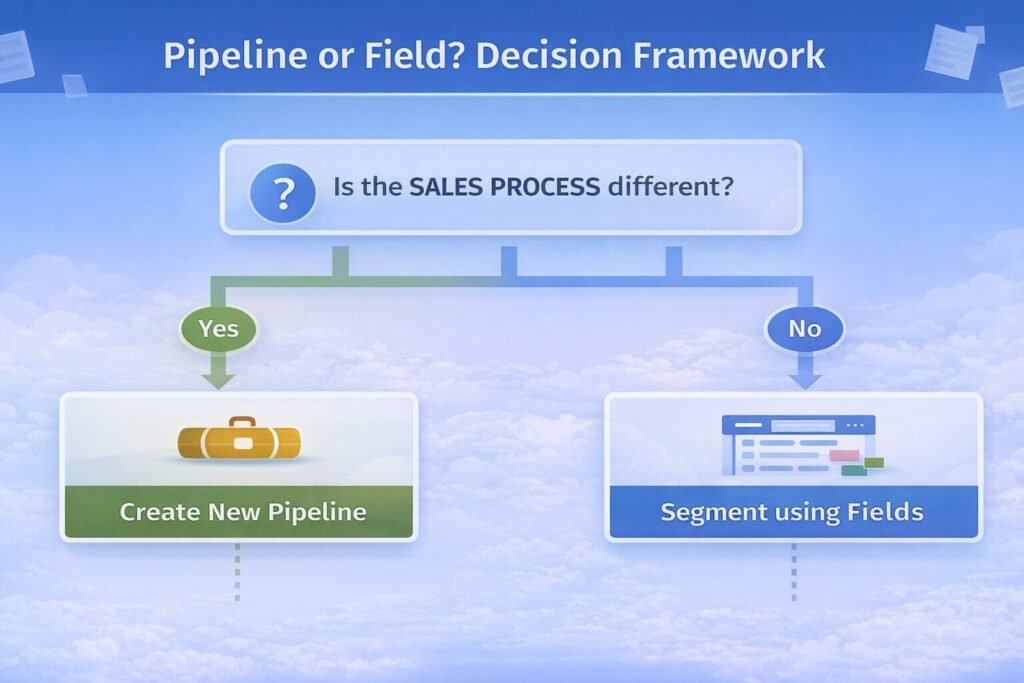
Before creating a new pipeline, apply this three-question test:
Question 1: Do Deals Follow Different Sequential Steps?
Example requiring separate pipelines:
Enterprise deals:
Discovery → Technical Evaluation → Security Review →
Legal Review → Executive Approval → Closed Won
SMB deals:
Demo → Proposal → Closed WonThese require separate pipelines because the STAGES are fundamentally different.
Example NOT requiring separate pipelines:
East Coast sales:
Discovery → Demo → Proposal → Negotiation → Closed WonWest Coast sales:
Discovery → Demo → Proposal → Negotiation → Closed WonThese use IDENTICAL stages. Use single pipeline with “Region” field to segment.
Question 2: Do Stage Durations and Conversion Rates Differ Significantly?
Compare velocity metrics:
| Metric | Enterprise | SMB | Requires Separate Pipeline? |
|---|---|---|---|
| Average sales cycle | 180 days | 14 days | YES – 13x difference |
| Discovery → Demo conversion | 40% | 85% | YES – Significantly different |
| Average deal size | $250k | $8k | NO – Use deal amount field |
Decision rule: If conversion rates vary by more than 30% OR cycle time differs by more than 3x, consider separate pipelines.
Question 3: Do Deals Require Different Team Members or Skillsets?
Example requiring separation:
Direct sales pipeline:
- Owned by: Account Executives
- Skillset: Relationship building, negotiation
- Compensation: Commission-based
Partner channel pipeline:
- Owned by: Channel Managers
- Skillset: Partner enablement, co-selling
- Compensation: Deal registration bonuses
Different owners with different workflows justify separate pipelines.
Example NOT requiring separation:
Product A sales:
- Owned by: All AEs
- Skillset: Same sales methodology
- Compensation: Same commission structure
Product B sales:
- Owned by: All AEs
- Skillset: Same sales methodology
- Compensation: Same commission structure
Use single pipeline with “Product” field to differentiate.
The Four-Pipeline Architecture Pattern
Most B2B companies need exactly four pipelines to handle complex sales motions:
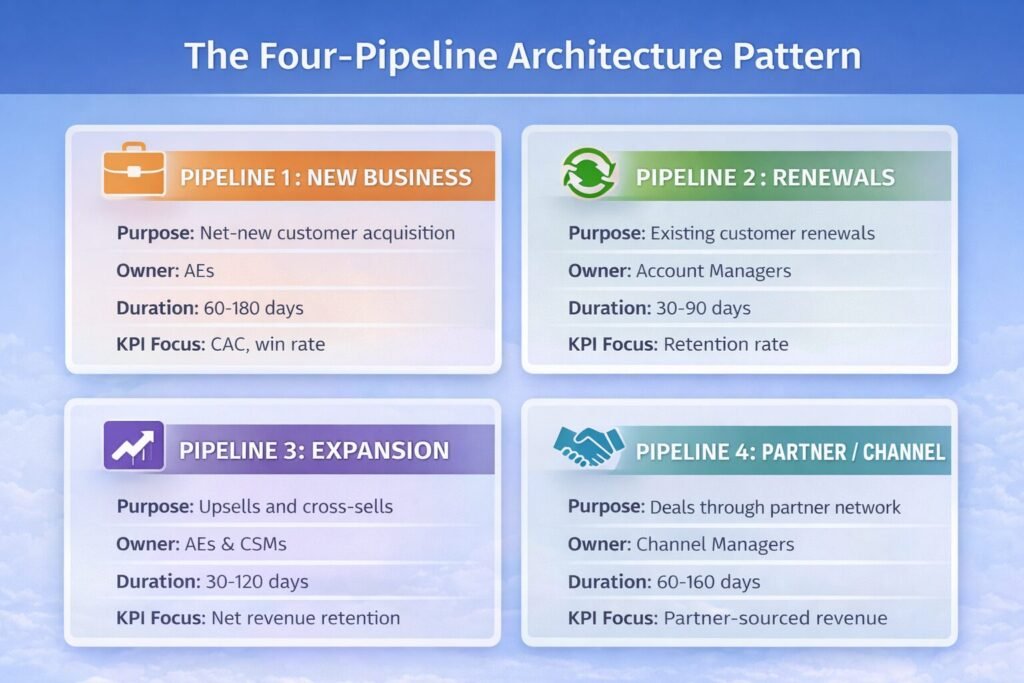
Why this works:
Each pipeline represents a FUNDAMENTALLY DIFFERENT sales process with distinct stages, timelines, and ownership models. Everything else gets handled through fields.
Stage Design: The Nested Framework Approach
Within each pipeline, stages must follow rigorous design principles.
The MECE Stage Principle
Stages must be Mutually Exclusive and Collectively Exhaustive.
Bad stage design (overlapping):
❌ Prospecting
❌ Qualified
❌ Discovery
❌ Demo Scheduled
Problem: Deal in “Discovery” could also be “Qualified” and have “Demo Scheduled” – ambiguous.
Good stage design (mutually exclusive):
✓ Qualification
✓ Discovery Completed
✓ Demo Delivered
✓ Proposal Sent
✓ Negotiation
✓ Closed Won/Lost
Each stage represents a COMPLETED milestone. Deals cannot be in two stages simultaneously.
The Observable Milestone Rule
Every stage must have a clear, verifiable exit criterion.
Stage design template:
┌──────────────────────────────────────────────┐
│ STAGE NAME: Discovery Completed             │
├──────────────────────────────────────────────┤
│ Entry Criterion:                             │
│ • Discovery call scheduled and held          │
│                                              │
│ Exit Criterion:                              │
│ • Pain points documented                     │
│ • Budget confirmed ($X - $Y range)           │
│ • Decision timeline identified               │
│ • Key stakeholders mapped                    │
│                                              │
│ Typical Duration: 7-14 days                  │
│ Win Probability: 20%                         │
└──────────────────────────────────────────────┘
This clarity prevents “stuck deals” where reps don’t know when to advance stages.
Stage Probability Calibration
Assign win probability percentages based on HISTORICAL data, not optimism.
Calibration process:
| Stage | Initial Guess | Actual Win Rate (Historical) | Calibrated Probability |
|---|---|---|---|
| Qualification | 10% | 8% | 8% |
| Discovery | 20% | 15% | 15% |
| Demo Delivered | 40% | 32% | 32% |
| Proposal Sent | 60% | 48% | 48% |
| Negotiation | 80% | 71% | 71% |
How to calculate historical win rate:
Win Rate for "Demo Delivered" Stage:

Deals that reached Demo Delivered: 500
Deals that eventually closed won: 160

Win Rate = 160 ÷ 500 = 32%

Set stage probability to 32%
This makes pipeline forecasting actually accurate instead of wildly optimistic.
The Shared vs Unique Stages Strategy
Some stages appear across all pipelines. Others are pipeline-specific.
Universal Stages (Appear in All Pipelines)
┌────────────────────────────────────────────────┐
│  STAGES THAT APPEAR IN EVERY PIPELINE:        │
│                                                │
│  • Closed Won                                  │
│  • Closed Lost                                 │
│                                                │
│  Why: Every deal ends in win or loss          │
└────────────────────────────────────────────────┘
Benefit: Unified reporting on wins/losses across all pipelines works automatically.
Pipeline-Specific Stages
NEW BUSINESS PIPELINE ONLY:
├─ Qualification (filter out bad fits)
├─ Discovery (understand needs)
└─ Technical Evaluation (enterprise only)

RENEWAL PIPELINE ONLY:
├─ Health Check (assess renewal risk)
├─ Renewal Discussion (negotiate terms)
└─ Churn Risk Mitigation (prevent loss)

EXPANSION PIPELINE ONLY:
├─ Usage Analysis (identify expansion opportunity)
├─ Business Case (justify additional spend)
└─ Approval Workflow (internal budget approval)
Why different: Each sales motion has unique qualifying steps that don’t apply to others.
Multi-Pipeline Reporting Architecture
The biggest multi-pipeline challenge: reporting across pipelines without manual aggregation.
The Universal Fields Approach
Create fields that work ACROSS all pipelines for unified reporting:
How this enables cross-pipeline reporting:
Instead of:
Report 1: New Business Pipeline Value
Report 2: Renewal Pipeline Value
Report 3: Expansion Pipeline Value
Report 4: Partner Pipeline Value
[Then manually sum in Excel]
You can:
Single Report: Total Pipeline Value
Filter by: Pipeline Type (shows breakdown)
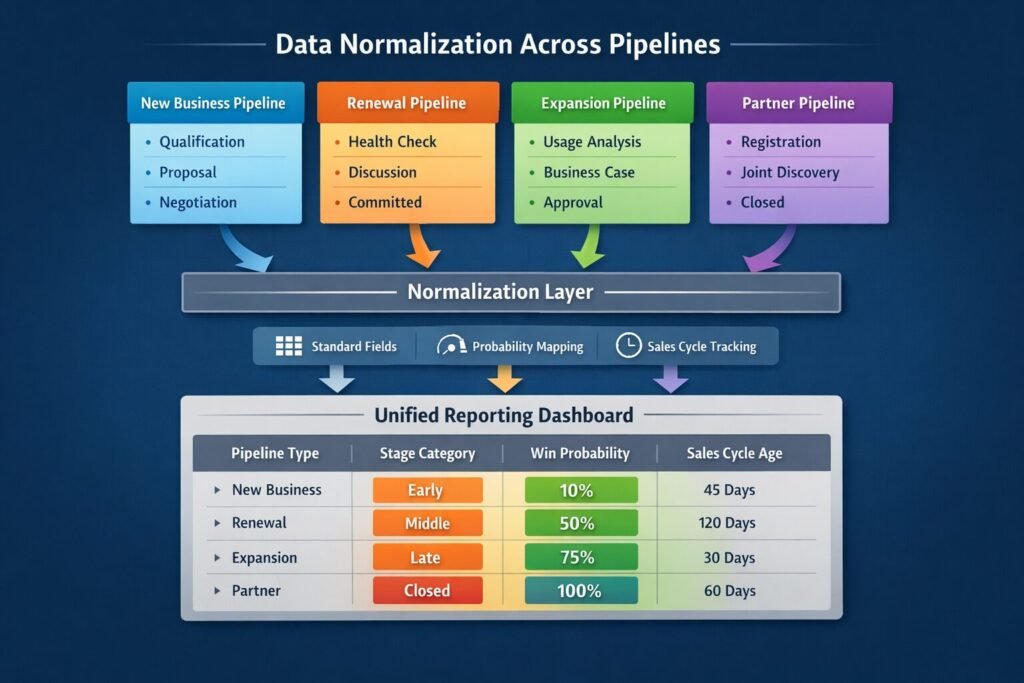
Group by: Deal Stage Category (shows early/middle/late)The Stage Category Mapping
Map pipeline-specific stages to universal categories:
| Pipeline | Stage Name | Stage Category | Normalized Probability |
|---|---|---|---|
| New Business | Qualification | Early | 10% |
| New Business | Discovery | Early | 20% |
| New Business | Proposal | Middle | 40% |
| New Business | Negotiation | Late | 70% |
| Renewal | Health Check | Early | 15% |
| Renewal | Discussion | Middle | 50% |
| Renewal | Committed | Late | 85% |
| Expansion | Identified | Early | 10% |
| Expansion | Approved | Late | 75% |
Benefit: Report on “Late Stage Deals” across ALL pipelines without caring about specific pipeline stages.
The Forecast Category Framework
Different pipelines contribute differently to forecasts:
┌────────────────────────────────────────────────────┐
│  FORECAST CATEGORY RULES                           │
├────────────────────────────────────────────────────┤
│                                                     │
│  COMMIT (90%+ probability):                        │
│  • New Business: Negotiation + verbal commitment   │
│  • Renewal: Customer confirmed renewal            │
│  • Expansion: Approved and processing             │
│                                                     │
│  BEST CASE (50-89% probability):                   │
│  • New Business: Proposal sent + active engagement │
│  • Renewal: Discussion ongoing + positive signals  │
│  • Expansion: Budget approved + scoping           │
│                                                     │
│  PIPELINE (1-49% probability):                     │
│  • All other active stages                         │
│                                                     │
│  CLOSED:                                           │
│  • Won or Lost                                     │
└────────────────────────────────────────────────────┘
This creates consistent forecasting language across different sales motions. Understanding your field relationships helps implement these calculated fields effectively.
Handling Deal Type Transitions
Real-world complication: deals change type during their lifecycle.
The Cross-Pipeline Movement Pattern
Scenario: Deal starts in New Business pipeline, customer wants to expand mid-deal.
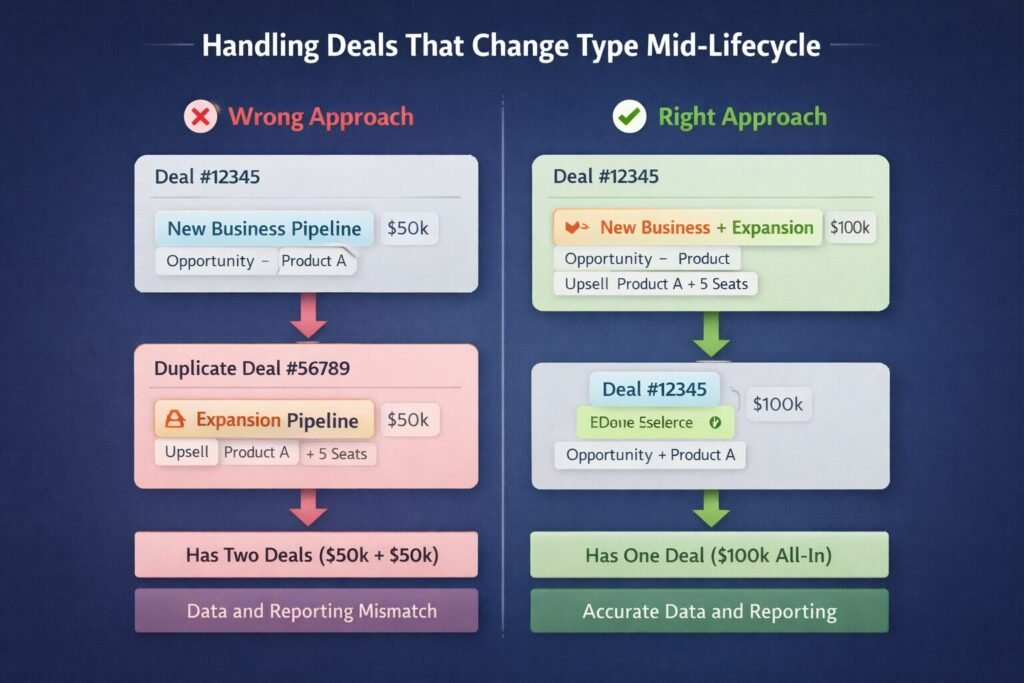
Implementation: Add “Deal Composition” field
Deal Composition (multi-select):
☑ New Business
☑ Expansion
☐ Renewal
☐ Professional Services
☐ Partner-Sourced
This tracks complex deals without creating duplicates or moving between pipelines.
The Pipeline Transfer Decision Tree
                    Deal needs to change pipeline?
                              │
                    ┌─────────┴─────────┐
                   YES                  NO
                    │                    │
            ┌───────┴────────┐      Update fields
            │                 │      Stay in pipeline
      Process actually   Just data
      changed?          segmentation?
            │                 │
           YES               NO
            │                 │
    Transfer to new     Use fields to
    pipeline            track change
            │
    ├─ Update pipeline
    ├─ Maintain deal history
    ├─ Update owner if needed
    └─ Document reason in notes
Example decisions:
Deal started as SMB, company grew to Enterprise size:
- Process change? NO (still follows same sales stages)
- Decision: STAY in New Business pipeline, update “Company Size” field
Deal started as Direct, company wants Partner to close it:
- Process change? YES (partner involvement changes workflow)
- Decision: TRANSFER to Partner pipeline, assign to Channel Manager
The Pipeline Routing Engine
Automate pipeline assignment to prevent user error.
Rule-Based Automatic Routing
┌────────────────────────────────────────────────────────┐
│  AUTOMATIC PIPELINE ASSIGNMENT RULES                   │
├────────────────────────────────────────────────────────┤
│                                                         │
│  IF [Account.Status] = "New"                           │
│  THEN assign to: NEW BUSINESS PIPELINE                 │
│                                                         │
│  IF [Account.Status] = "Customer"                      │
│  AND [Deal Type] = "Renewal"                           │
│  THEN assign to: RENEWAL PIPELINE                      │
│                                                         │
│  IF [Account.Status] = "Customer"                      │
│  AND [Deal Type] = "Upsell" OR "Cross-sell"            │
│  THEN assign to: EXPANSION PIPELINE                    │
│                                                         │
│  IF [Partner Sourced] = TRUE                           │
│  THEN assign to: PARTNER PIPELINE                      │
│                                                         │
│  ELSE: Prompt user to select pipeline                  │
└────────────────────────────────────────────────────────┘
Benefit: 85-90% of deals route automatically. Users only choose pipeline for edge cases.
The Deal Creation Form Logic
Simplify pipeline selection with smart forms:
Traditional approach (confusing):
Create New Deal Form:
├─ Deal Name: [blank field]
├─ Amount: [blank field]
├─ Close Date: [blank field]
├─ Pipeline: [dropdown with 8 options - which one?]
└─ Stage: [dropdown with 30+ stages across all pipelines]
Smart approach (guided):
Create New Deal Form:

Step 1: What type of deal is this?
○ New customer acquisition
○ Existing customer renewal
○ Existing customer expansion
○ Partner-sourced deal

[User selects "New customer acquisition"]

Step 2: Deal details
├─ Company: [lookup - auto-populates if existing]
├─ Amount: [currency field]
├─ Expected Close Date: [date picker]
└─ [Hidden] Pipeline: NEW BUSINESS (auto-assigned)
    [Hidden] Initial Stage: Qualification (auto-set)

Step 3: Qualification Info
├─ Budget Confirmed?: [yes/no]
├─ Decision Timeline: [dropdown]
└─ Authority: [dropdown]

[System automatically assigns to New Business pipeline,
 sets stage to Qualification based on Step 1 selection]
This reduces pipeline selection errors from 20-30% to under 5%.
Multi-Pipeline Performance Metrics
Different pipelines require different success metrics.
Pipeline-Specific KPIs
| Pipeline | Primary Metric | Target | Measurement Period |
|---|---|---|---|
| New Business | Customer Acquisition Cost (CAC) | <$5,000 | Quarterly |
| New Business | Win Rate | >25% | Quarterly |
| New Business | Avg Sales Cycle | <90 days | Monthly |
| Renewal | Gross Retention Rate | >90% | Monthly |
| Renewal | Time to Renewal Decision | <30 days pre-renewal | Monthly |
| Expansion | Net Revenue Retention | >110% | Quarterly |
| Expansion | Expansion Rate | >20% of base | Quarterly |
| Partner | Partner-Sourced Revenue % | 30% of total | Quarterly |
Why different: Each pipeline optimizes for different business outcomes.
The Unified Dashboard Approach
Create role-specific dashboards that aggregate across pipelines:
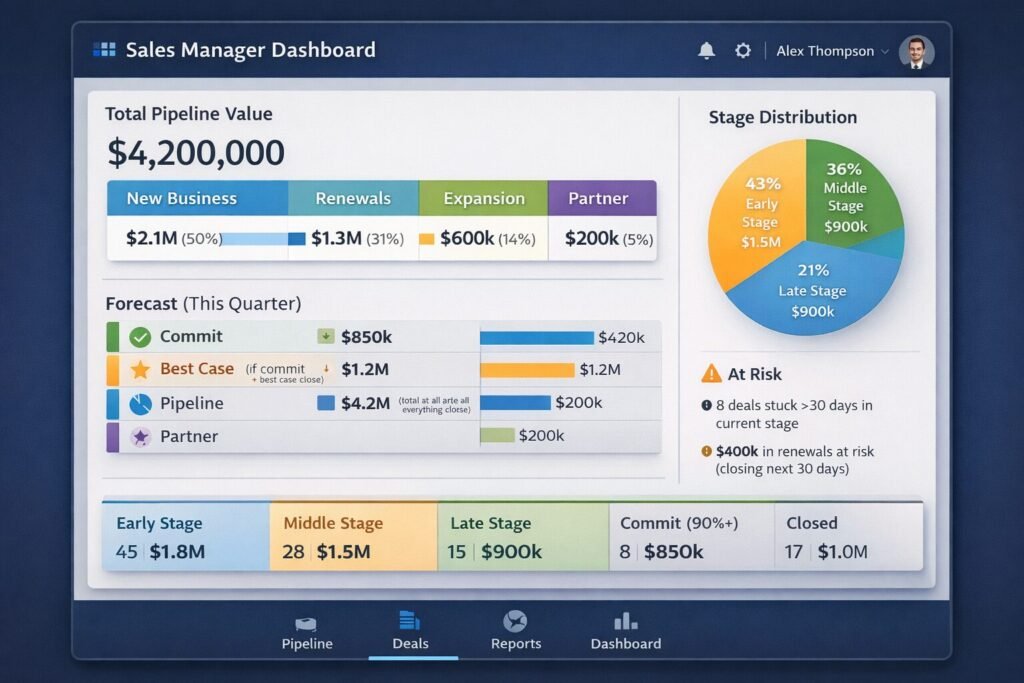
All data aggregated across four pipelines into single unified view.
When NOT to Use Multiple Pipelines
Resist the urge to create pipelines for every variation.
Red Flags You’re Over-Pipelining
❌ Creating pipelines for temporal variations:
- “Q1 Pipeline”
- “Q2 Pipeline”
- “2024 Pipeline”
Fix: Use close date fields and date-based reporting filters instead.
❌ Creating pipelines for product variations:
- “Product A Pipeline”
- “Product B Pipeline”
- “Product C Pipeline”
Fix: Use “Product” field to segment. Coordinate with your field naming conventions for consistency.
❌ Creating pipelines for team variations:
- “East Coast Pipeline”
- “West Coast Pipeline”
- “EMEA Pipeline”
Fix: Use “Sales Region” field. Pipelines for process, fields for segmentation.
❌ Creating pipelines for deal size variations:
- “Enterprise Pipeline”
- “Mid-Market Pipeline”
- “SMB Pipeline”
Fix: Use “Deal Size Category” field UNLESS sales process actually differs significantly (different stages, different cycle times).
Implementation Roadmap
Phase 1: Audit Current State (Week 1-2)
Tasks:
- Document all existing pipelines
- Map actual sales processes being followed
- Identify where pipelines share identical stages
- Calculate stage win rates and durations for each pipeline
Deliverable: Pipeline consolidation recommendation document
Phase 2: Design Target Architecture (Week 3-4)
Tasks:
- Define 3-5 core pipelines based on process variation
- Design stages for each pipeline following MECE principle
- Create universal fields for cross-pipeline reporting
- Build pipeline routing rules
Deliverable: Target pipeline architecture specification
Phase 3: Build and Test (Week 5-6)
Tasks:
- Configure new pipelines in CRM
- Create calculated fields for unified reporting
- Build automation for pipeline routing
- Test with sample deals
Deliverable: Configured pipelines ready for migration
Phase 4: Migrate Data (Week 7-9)
Tasks:
- Move deals from old pipelines to new structure
- Update historical data for reporting continuity
- Validate data integrity post-migration
Deliverable: All deals in new pipeline structure
Phase 5: Train and Launch (Week 10-12)
Tasks:
- Train sales team on new pipeline logic
- Document pipeline selection criteria
- Create quick reference guides
- Monitor adoption and fix issues
Deliverable: Full team operating on new pipeline structure
Measuring Multi-Pipeline Success
Track these metrics to validate your pipeline architecture:
System Health Metrics
┌──────────────────────────────────────────────┐
│  PIPELINE ARCHITECTURE HEALTH                │
├──────────────────────────────────────────────┤
│                                               │
│  Pipeline Selection Accuracy:                │
│  Target: >95% of deals in correct pipeline   │
│  Current: 94% ✓ (acceptable)                 │
│                                               │
│  Stage Progression Time:                     │
│  Target: <7 days average per stage           │
│  Current: 5.2 days ✓ (good)                  │
│                                               │
│  Stuck Deal Rate:                            │
│  Target: <10% of deals stuck >30 days        │
│  Current: 8% ✓ (acceptable)                  │
│                                               │
│  Reporting Query Time:                       │
│  Target: <3 seconds for standard reports     │
│  Current: 1.8 seconds ✓ (excellent)          │
│                                               │
│  User Satisfaction:                          │
│  Target: >80% find pipelines clear           │
│  Current: 87% ✓ (good)                       │
└──────────────────────────────────────────────┘
Multi-Pipeline Architecture as Competitive Advantage
Pipeline design isn’t administrative overhead—it’s strategic infrastructure enabling:
Accurate forecasting: Clean pipeline structure enables reliable revenue predictions. Companies with well-structured pipelines forecast within 5-10% accuracy vs 25-40% for chaotic systems.
Faster rep onboarding: New reps understand 4 clear pipelines in days vs spending weeks confused by 15+ overlapping ones.
Better resource allocation: Know which sales motions generate highest ROI when pipelines properly segment by process type.
Scalable operations: Add new products, regions, or segments without creating new pipelines by using fields for segmentation.
The companies my team works with that implement structured multi-pipeline architectures experience:
- 60-70% faster pipeline reporting
- 40-50% improvement in forecast accuracy
- 30-40% reduction in deals stuck in wrong pipeline
- 50-60% faster new rep productivity
Your pipeline architecture determines whether complexity creates clarity or chaos. Structure for process from day one. Review the complete architecture guide to integrate pipeline design into your overall CRM strategy.

The Sports Angel Team is a group of technology specialists, software consultants and digital business advisors with combined experience across hundreds of implementations for small businesses, agencies and startups across the United States. Every tool we review is tested firsthand before we recommend it.